Note
Click here to download the full example code
Normal modes of a protein
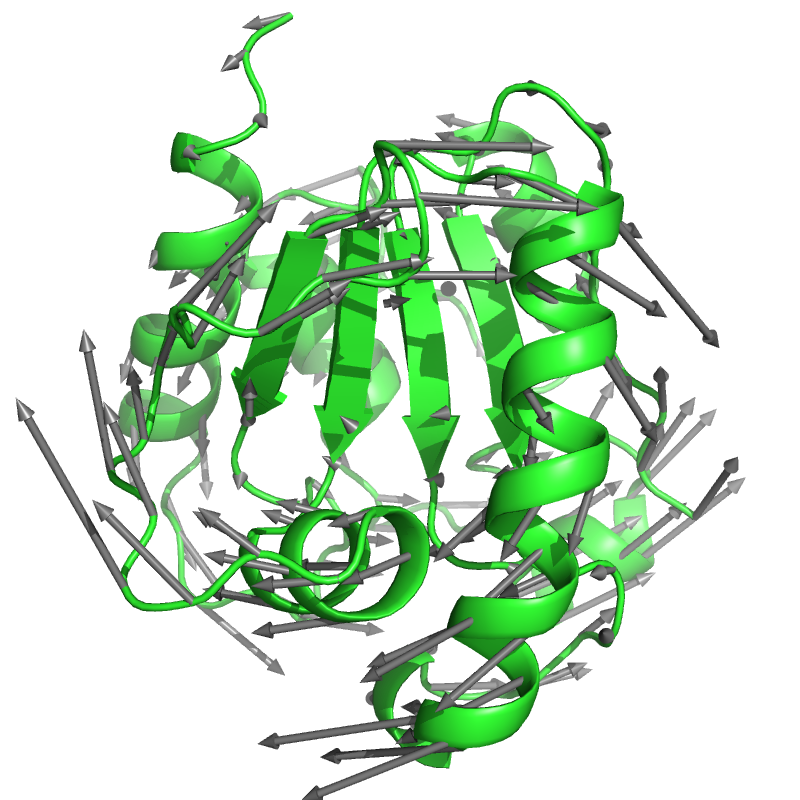
This example script calculates the normal modes of an ANM and visualizes one of them using arrows.

# Code source: Patrick Kunzmann
# License: BSD 3 clause

import numpy as np
import biotite.structure as struc
import biotite.structure.io.mmtf as mmtf
import biotite.database.rcsb as rcsb
import ammolite
import springcraft


PNG_SIZE = (800, 800)


PDB_ID = "1MUG"
# The normal mode to be visualized
# '6' is the slowest (most significant) one that does not correspond to
# translation or rotation of the system
MODE = 6
# The maximum arrow length depicting the displacement
# (The length of the ANM's eigenvectors make only sense when compared
# relative to each other, the absolute values have no significance)
AMPLITUDE = 10


# Load structure
mmtf_file = mmtf.MMTFFile.read(rcsb.fetch(PDB_ID, "mmtf"))
structure = mmtf.get_structure(mmtf_file, model=1, include_bonds=True)

# Filter first peptide chain
protein_chain = structure[
    struc.filter_amino_acids(structure)
    & (structure.chain_id == structure.chain_id[0])
]
# Filter CA atoms
ca_mask = (protein_chain.atom_name == "CA") & (protein_chain.element == "C")
ca = protein_chain[ca_mask]

ff = springcraft.InvariantForceField(13.0)
anm = springcraft.ANM(ca, ff)
_, eigen_vectors = anm.eigen()
vector = eigen_vectors[MODE].reshape(-1, 3)
vector /= np.max(vector)
vector *= AMPLITUDE


ammolite.cmd.set("cartoon_oval_length", 1.0)
pymol_object = ammolite.PyMOLObject.from_structure(protein_chain)
pymol_object.show_as("cartoon")
# Show eigenvectors as arrows
ammolite.draw_arrows(
    ca.coord, ca.coord + vector,
    radius=0.2, head_radius=0.4, head_length=1.0
)
ammolite.cmd.set_view((
     0.605540633,    0.363677770,   -0.707855821,
    -0.416691631,    0.902691007,    0.107316799,
     0.678002179,    0.229972601,    0.698157668,
     0.000000000,    0.000000000, -115.912551880,
    32.098876953,   31.005725861,   78.377349854,
    89.280677795,  142.544403076,  -20.000000000
))
ammolite.show(PNG_SIZE)
